Quadrant Framework
How we define economic regimes:
We identify the directional momentum of growth and inflation using internally constructed signals built from market‑based and economic indicators.
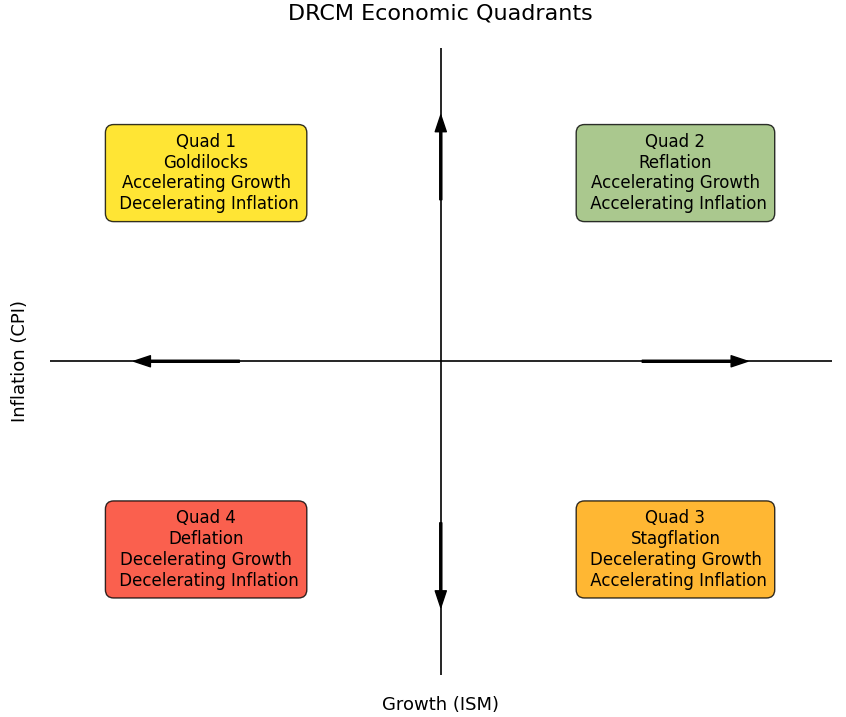
By evaluating whether these signals are accelerating or decelerating, we classify the current macro environment into one of four economic quadrants; this economic quadrant framework then guides our asset allocation.
How asset classes perform across economic regimes
We backtested the performance of various asset classes across four economic regimes defined by shifts in inflation and growth momentum, using over 30 years of market cycle data. Our performance metrics include compound annual growth rate (CAGR), annualized volatility, Sharpe ratio (without a risk-free rate), and the total count of monthly observations, all calculated within each regime. The displayed treemaps visually represents these results, with the size of each asset’s box proportional to the number of monthly observations supporting its performance—larger boxes indicate higher confidence that the asset’s relationship with the regime is statistically meaningful.
Interactive Treemaps
Quadrant 1 (Goldilocks): Growth assets such as technology and consumer discretionary stocks tend to outperform, while defensive sectors and inflation hedges typically lag.
Quadrant 2 (Reflation): Commodities, cyclicals, and financials often outperform. Inflation-sensitive sectors gain, and growth sectors moderate.
Quadrant 3 (Stagflation): Defensive sectors and inflation hedges like utilities and real assets usually outperform, while cyclical and growth stocks underperform.
Quadrant 4 (Deflation): Fixed income and high-quality bonds dominate, while equities and commodities often lag.